Operating results
The Company’s main achievements in 2018:
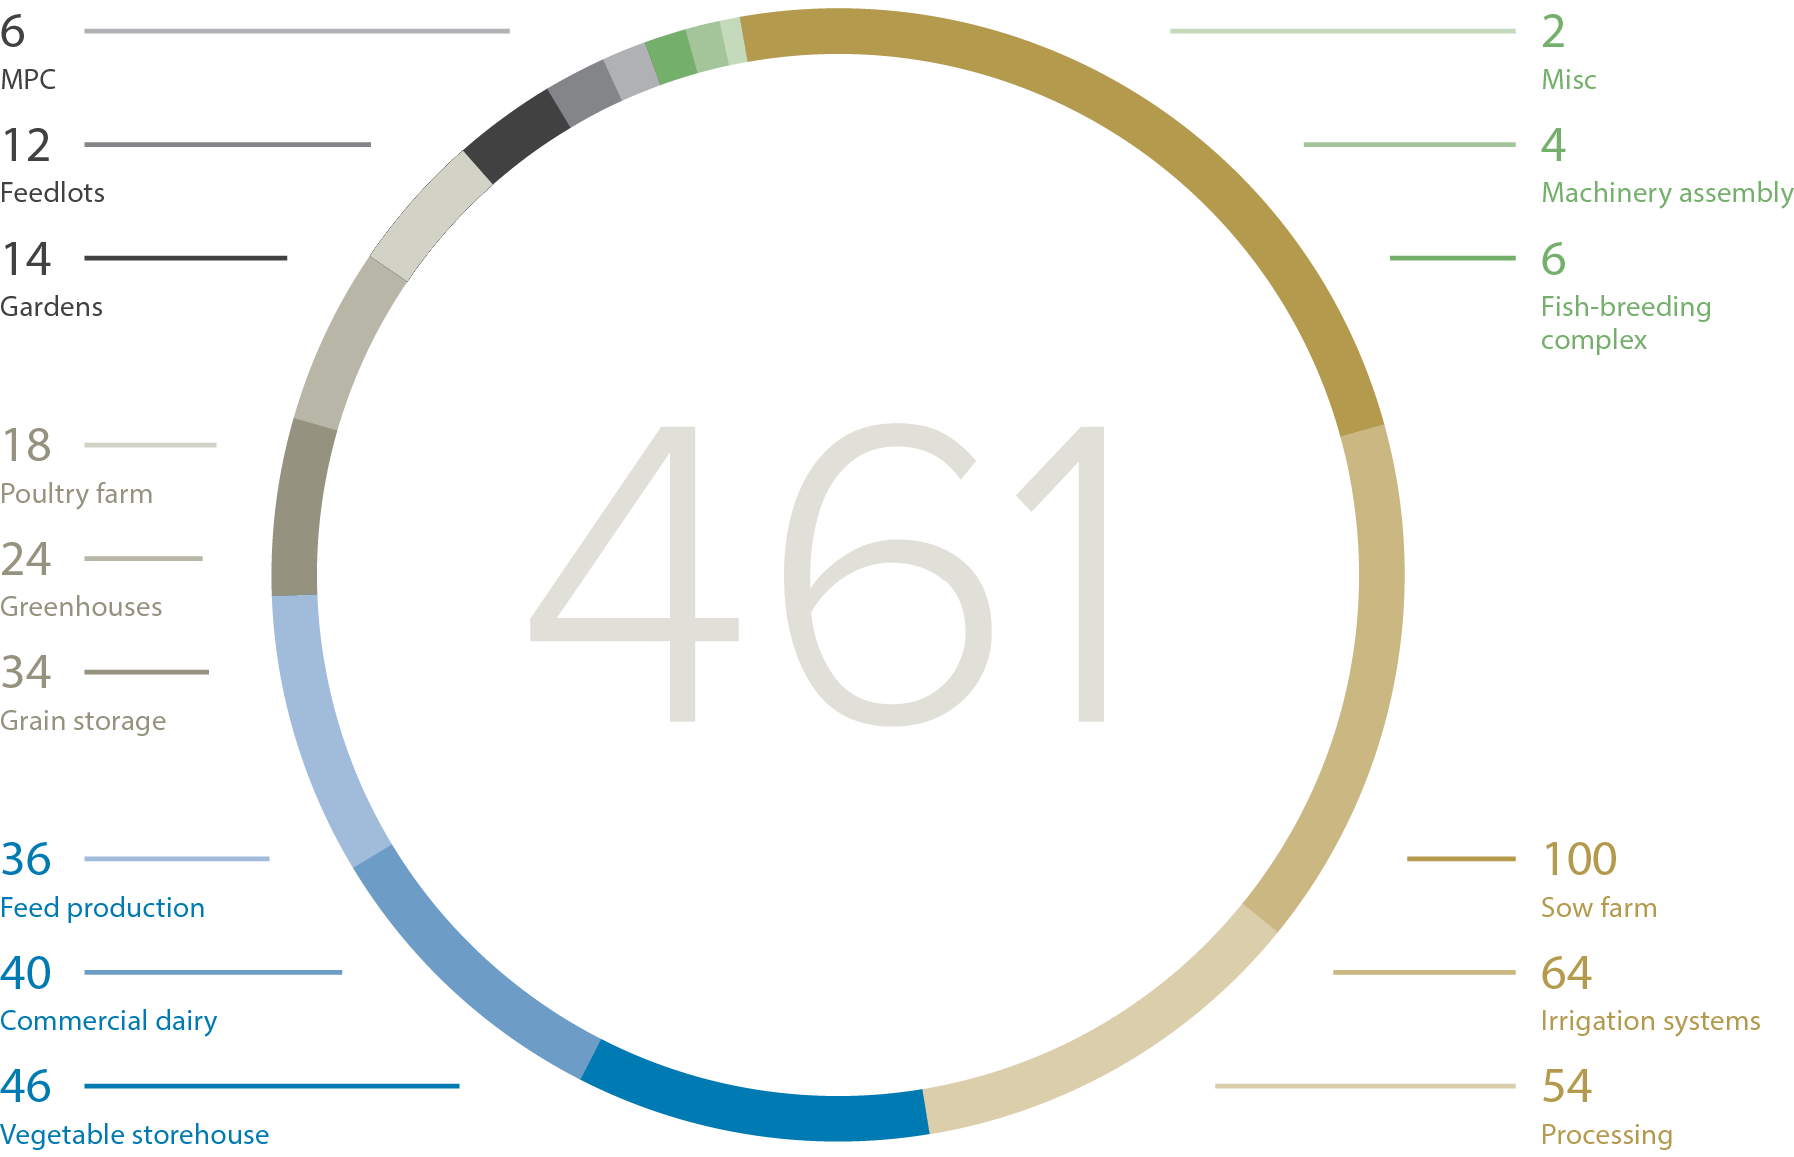
Amount of investments in 2000-2018, bn tenge
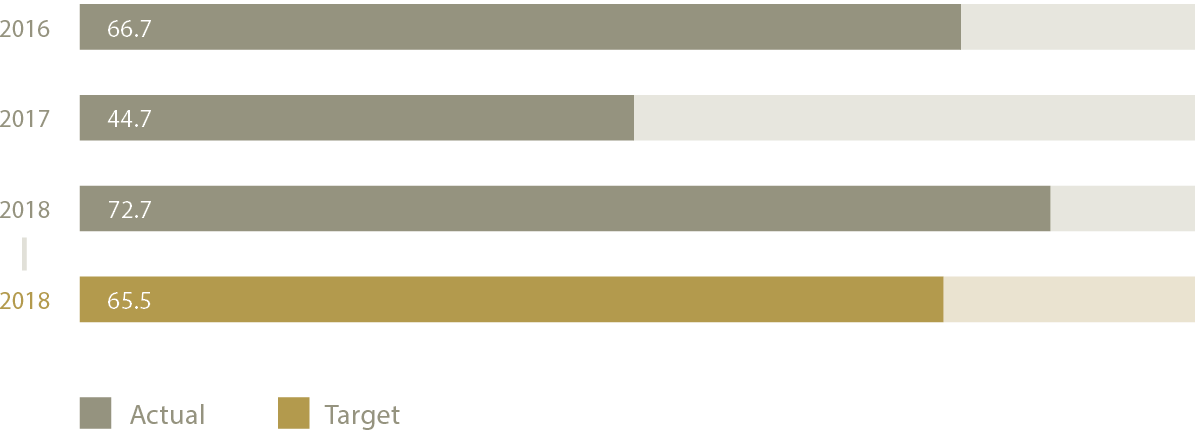
694.6
BN
TENGE
BN
TENGE
THE TOTAL AMOUNT
OF INVESTMENTS
IN 2000-2018
OF INVESTMENTS
IN 2000-2018
LEASE OF FARMING MACHINERY IN 2000-2018, in units and sums
| Equipment | 2016 | 2017 | 2018 | 2000–2018 | ||||
| Units | Amount | Units | Amount | Units | Amount | Units | Amount | |
| Sowing machines | 56 | 1,266 | 31 | 509 | 72 | 1,736 | 1,256 | 45,529 |
| Tractors | 962 | 11,963 | 788 | 9,432 | 1,032 | 15,592 | 12,715 | 91,239 |
| Harvesters | 490 | 24,085 | 283 | 16,896 | 495 | 28,268 | 10,299 | 217,301 |
| Seeders | 104 | 2,762 | 124 | 1,703 | 133 | 2,626 | 2,179 | 11,364 |
| Other machinery | 1,474 | 11,724 | 1,150 | 7,830 | 1,550 | 12,762 | 15,954 | 79,414 |
| Equipment | 33 | 3,960 | 24 | 3,807 | 144 | 1,987 | 596 | 58,839 |
| Total | 3,119 | 55,760 | 2,400 | 40,176 | 3,426 | 62,972 | 42,999 | 503,685 |
In 2018, the Company commissioned seven investment projects, including:
2
vegetable storehouses
with a 3.3-thousand-ton capacity
with a 3.3-thousand-ton capacity
2
commercial dairy
farms with a capacity of 7,706 tons
farms with a capacity of 7,706 tons
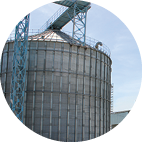
2
grain depots with
a capacity of 15,000 tons
a capacity of 15,000 tons
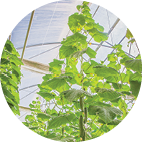
1
greenhouse
with an area of 4.1 ha
with an area of 4.1 ha
Structure of projects commissioned in 2007–2018
